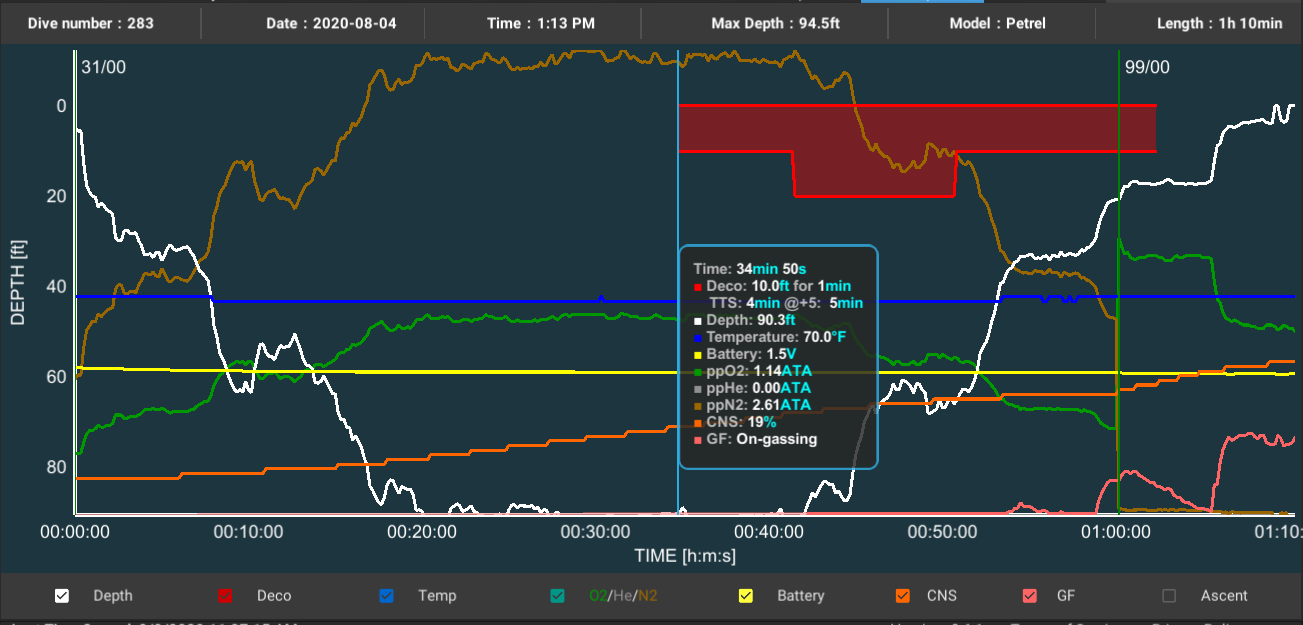
From left to right the colored lines are explained in conjunction with the data box captured at 34 minutes into the dive.
The white line is the depth line. Max Depth 94.5 ffw for a one hour and ten minute dive
The red box is at the point where the dive required staged decompression at time 34 minutes.
The blue line shows a constant temperature of 70 degrees F
The green line shows the partial pressure of oxygen throughout the dive
The orange line near the top shows the partial pressure of nitrogen throughout the dive
The yellow line shows a constant battery voltage
The orange ascending line near the bottom shows cumulative CNS O2 percentage
The pink line shows the GF% gradual increase with the ascent
The PpN2 is 2.61 ata - Compare this PpN2 to that at the end of the last decompression stop.
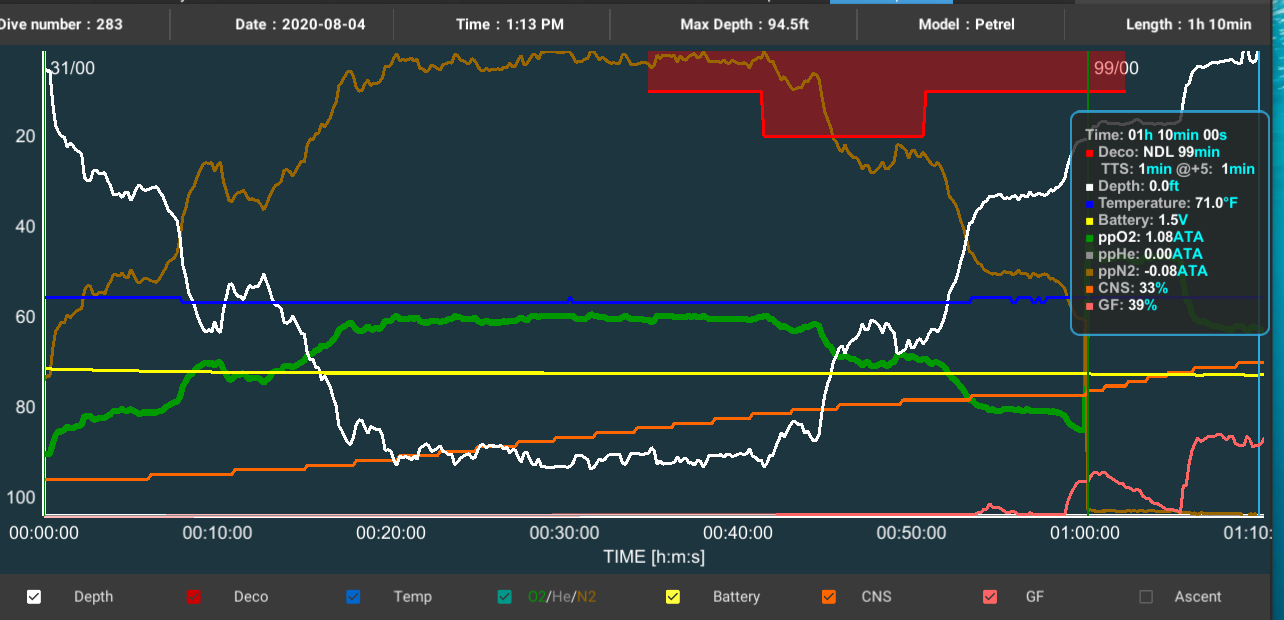
The image below shows the data box at the end of the dive
Ending CNS was 33%
Ending GF was 39%
PpN2 was -0.08% since we were breathing pure oxygen, this has been described to me as a "pressure vacancy" which is the crux of acelerated decompression. The pressure vacancy is essentially a large "pressure gradient" which allows/causes inert gas to come out of solution faster, thereby "accelerating decompression".
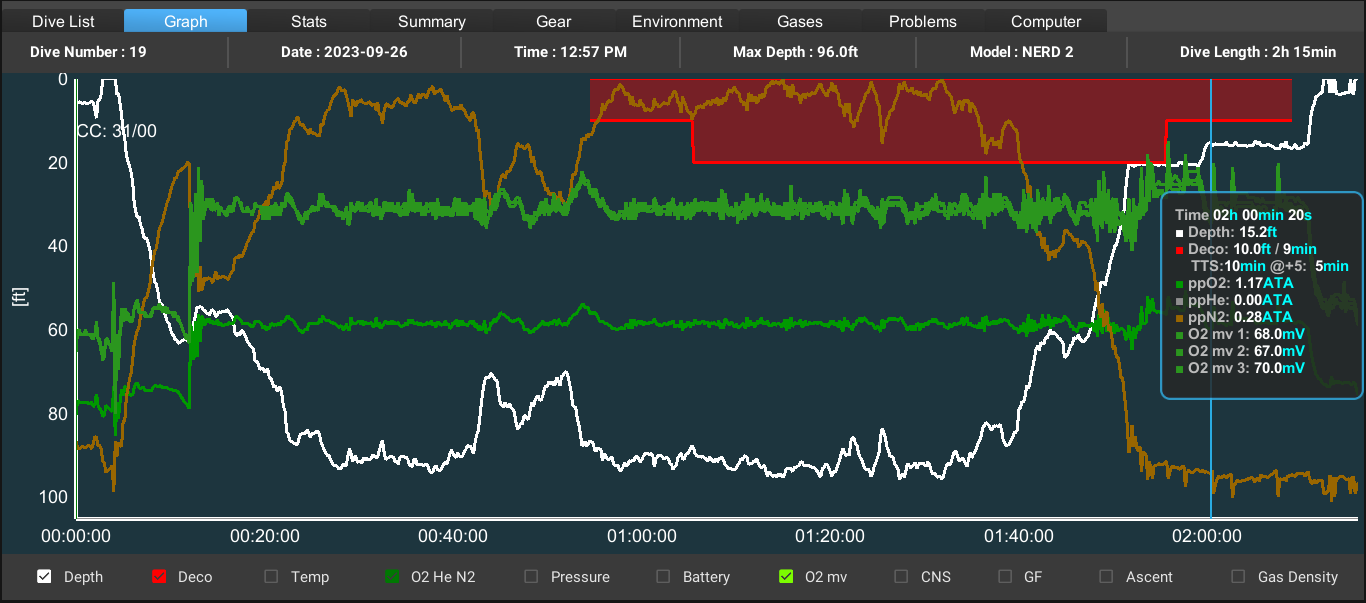
Shearwater NERD2 Download
This is an image of a download from a NERD2 off of my Choptima Rebreather. Cell mV values are shown.